
Why Your PMO Dashboard Is Lying to You (And What to Do About It)
Let me paint a picture you have probably lived through. It is Monday morning. You pull up your PMO dashboard. Everything looks green. Project timelines are on track. Budgets are within tolerance. Resource utilization is humming along at 85%. You walk into the executive steering committee feeling good about things.
Then the CFO asks a question you were not ready for: "Which of these projects is actually going to move the needle on our Q3 revenue target?"
Silence.
Your dashboard can tell her how many projects are on schedule. It cannot tell her which ones matter most. And that gap between what your dashboard shows and what your executives need to know? That is exactly where most PMOs lose credibility.
I have seen this play out dozens of times across organizations of all sizes. The PMO builds out a beautifully detailed reporting framework, complete with RAG statuses, milestone trackers, and resource heatmaps. The team spends hours every week collecting updates, colour-coding cells, and making sure the data is clean. And yet, when the moment comes to influence a real business decision, the dashboard falls flat.
Here is the hard truth: most PMO dashboards are designed to track activity, not to drive decisions. And in 2026, with executives under more pressure than ever to demonstrate ROI on every initiative, activity-based reporting won't cut it anymore.
THE ACTIVITY TRAP
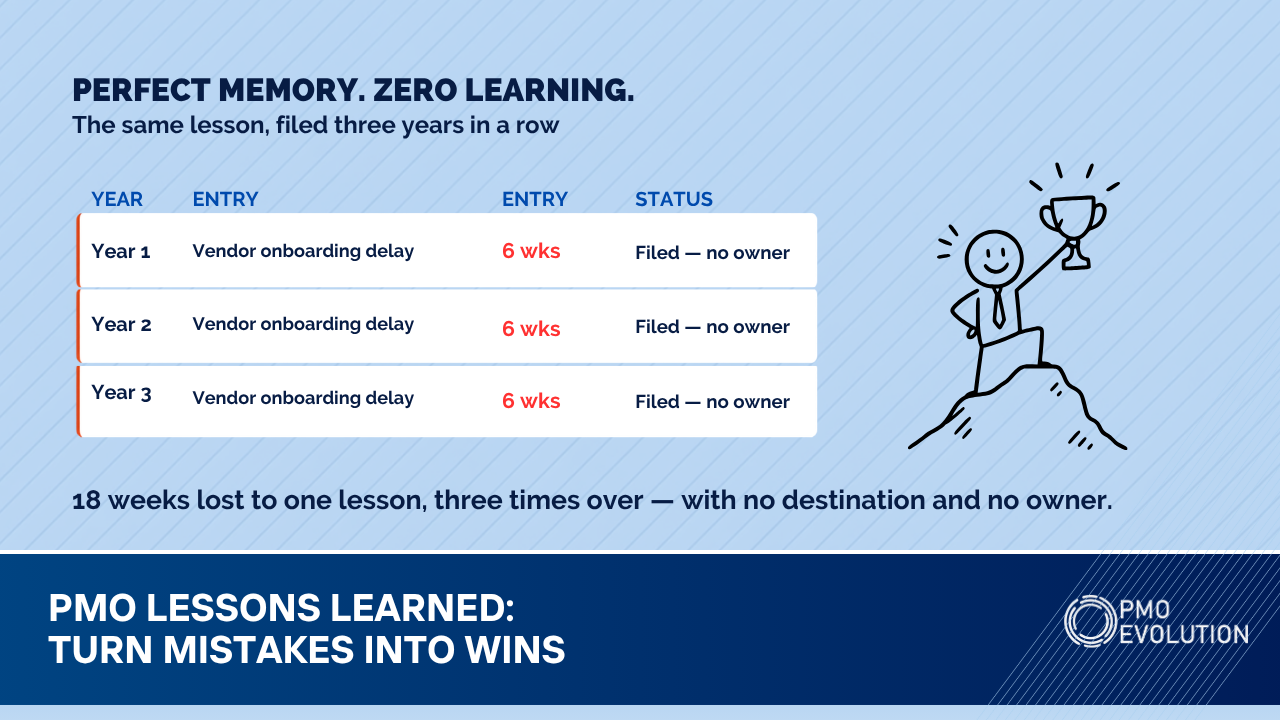
The root of the problem is something I call the "activity trap." PMOs get so focused on measuring what is happening that they forget to measure what matters. Think about the typical metrics on a PMO dashboard: on-time delivery rate, budget variance, number of active projects, resource utilization percentage, and milestone completion rates.
None of these tells your executives whether the portfolio is actually delivering value. They are lagging indicators at best, and vanity metrics at worst. A project can be perfectly on time and on budget while delivering something nobody actually needs.
We worked with an organization last year that had an impressive 92% on-time delivery rate. Their PMO leader was proud of that number, and rightfully so from an execution standpoint. But when we dug into the portfolio, we found that nearly 40% of completed projects had never achieved the business outcomes they were originally justified by. The projects shipped on time. The benefits never materialized.
WHAT DECISION-QUALITY INTELLIGENCE LOOKS LIKE
So what should your PMO dashboard actually show? The shift is from "what is happening" to "so what" and "now what." Decision-quality intelligence answers three questions your executives are always asking, whether they say it out loud or not.
First, are we investing in the right things? This is about strategic alignment and portfolio balance. Your dashboard should make it easy to see how the portfolio maps to your organization's top three to five strategic priorities. If 60% of your project spend is going toward "keep the lights on" work and only 15% is funding growth initiatives, that is a conversation your leadership team needs to have.
Second, are we going to get what we were promised? This is about benefits realization, and it is where most PMOs have the biggest blind spot. Every project gets approved based on a business case with projected benefits. How many PMOs actually track whether those benefits show up after delivery? In my experience, fewer than 20%. If you are using a tool like Smartsheet, you can build benefits tracking directly into your portfolio workspace. Create a sheet that links each project to its projected benefits, assigns an owner for each benefit, and tracks realization on a quarterly cadence. It does not have to be complicated, but it does have to exist.
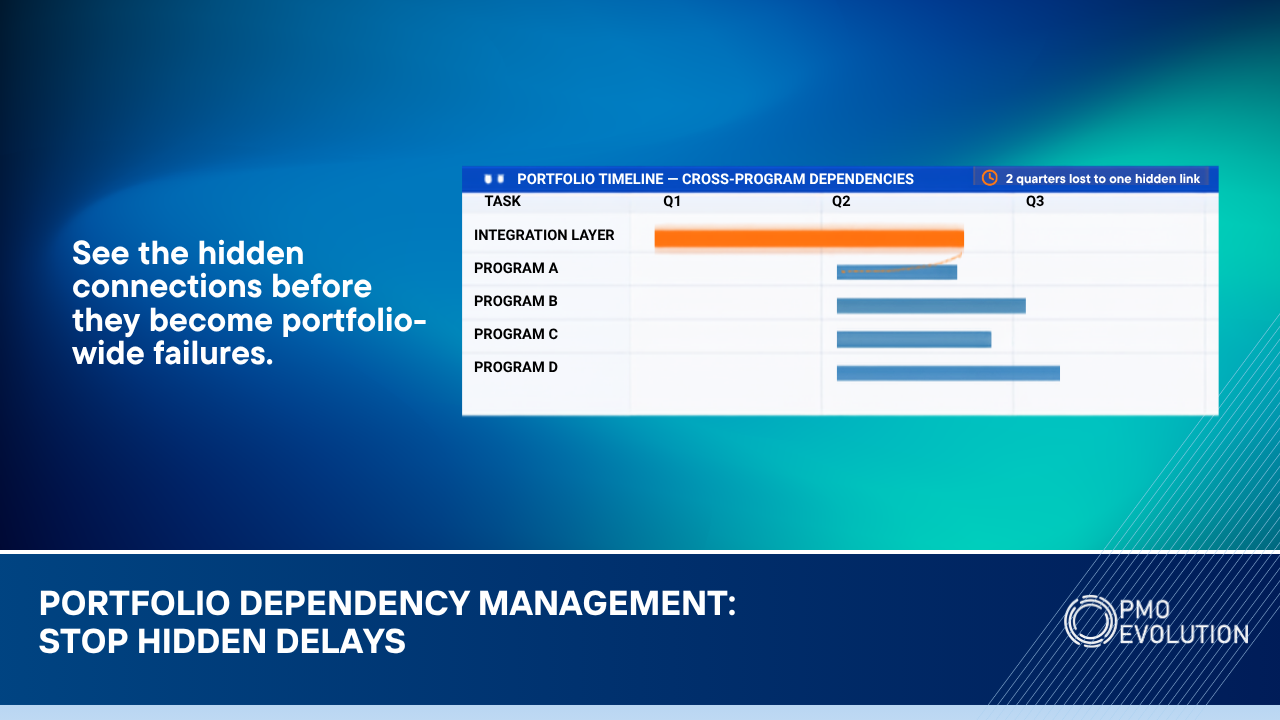
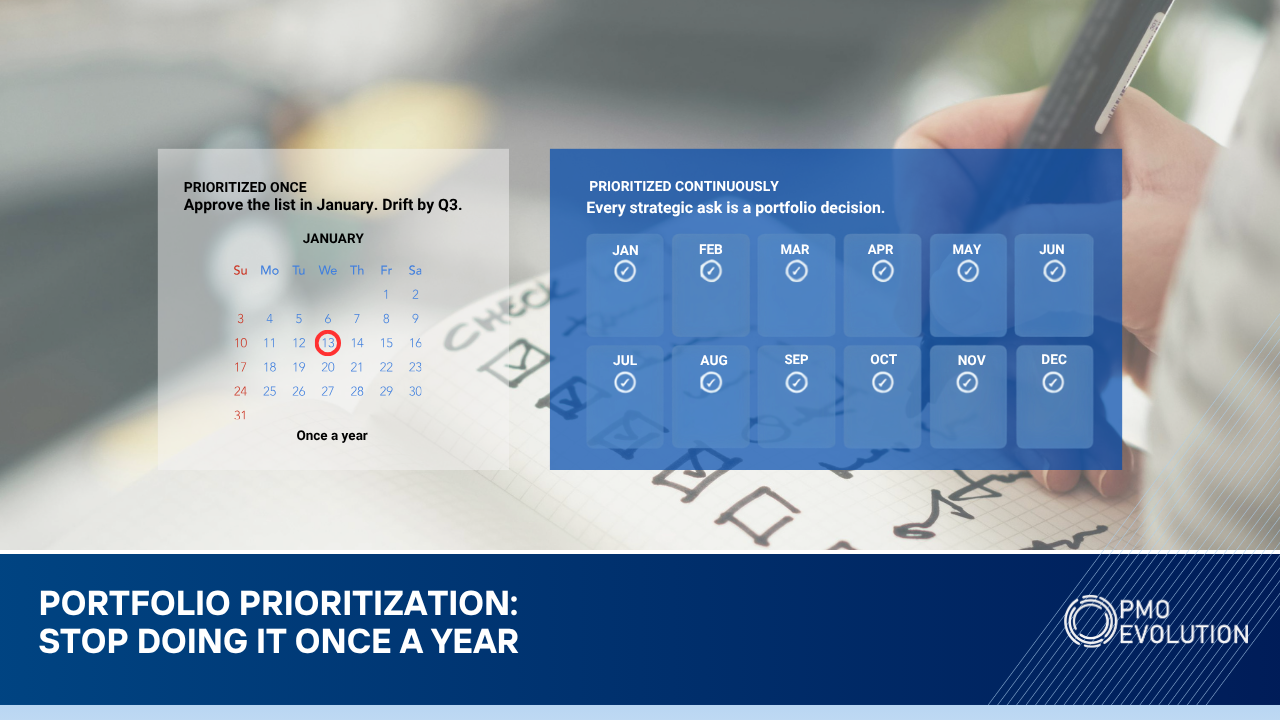
Third, where should we focus our limited capacity? This is about trade-offs and prioritization. Your executives do not want to see a list of 47 projects with green statuses. They want to know which five projects need their attention, which ones should be paused or killed, and where the resource bottlenecks are going to hit in the next 90 days.
A PRACTICAL FRAMEWORK FOR THE SHIFT
If you are reading this and thinking "great, but where do I start," here is a practical approach I have used with multiple clients. It ties directly to the Portfolio Definition layer of the Vision2Value Framework, because you cannot report on value if you have not defined what value means upfront.
Step one: audit your current metrics. Take every metric on your dashboard and ask "does this help an executive make a decision?" If the answer is no, it either needs to be reframed or removed. You do not have to kill all activity metrics, but they should be supporting actors, not the main event.
Step two: define value metrics for each strategic priority. Work with your executive sponsors to agree on two to three measurable outcomes for each strategic priority. These become your portfolio-level KPIs. For example, if one priority is "improve customer retention," your value metrics might be Net Promoter Score improvement, customer churn reduction, and support ticket resolution time.
Step three: build the bridge. Connect each project in your portfolio to at least one value metric. If a project cannot be connected to any value metric, that is a red flag worth discussing with your governance board.
Step four: report the story, not just the data. Your executive dashboard should tell a narrative. Lead with the strategic priorities and how the portfolio is tracking against them. Show the risks to value delivery, not just risks to timelines. Highlight the decisions that need to be made, and give your executives the information they need to make them.
THE TECHNOLOGY PIECE
I want to touch briefly on the technology angle here, because I see a lot of PMOs either over-investing or under-investing in their reporting tools. You do not need a six-figure BI platform to deliver decision-quality intelligence. If your organization is running on Smartsheet, you already have what you need to build portfolio-level dashboards that connect projects to strategic outcomes. Use dashboards to create executive views that pull from portfolio-level summary sheets. Use formulas and cross-sheet references to calculate value-oriented metrics. Use automated workflows to flag when benefits tracking is overdue or when portfolio balance shifts outside your target ranges.
The technology is not the bottleneck. The bottleneck is the mindset shift from "report everything" to "report what matters."
THE PAYOFF
When you make this shift, something interesting happens. Executives stop skipping your steering committee meetings. They start asking for your input on strategic decisions. They begin to see the PMO as a strategic partner rather than an administrative function.
One client we worked with made this transition a few months ago. Within two quarters, their PMO leader had a standing invitation to the monthly executive leadership meeting, something that had never happened before. Not because they changed their delivery capabilities, but because they changed the conversation from "here is what we are doing" to "here is what we are achieving and here is what we should do next."
That is the real power of decision-quality intelligence. It does not just make your dashboards better. It changes your PMO's seat at the table.
If your dashboard is full of green lights but your executives still do not trust your PMO's strategic value, it might be time to rethink what you are measuring. Start with one strategic priority. Build the value connection. Show the story. The rest will follow.
Visit our website: pmoevolution.com
Follow us on LinkedIn: PMO Evolution
Subscribe on YouTube: PMO Evolution