
There’s a quiet truth inside many PMOs that leaders don’t often say out loud:
They’re busy, but they’re not influential.
Progress reports are delivered. Governance meetings are held. Plans are updated.
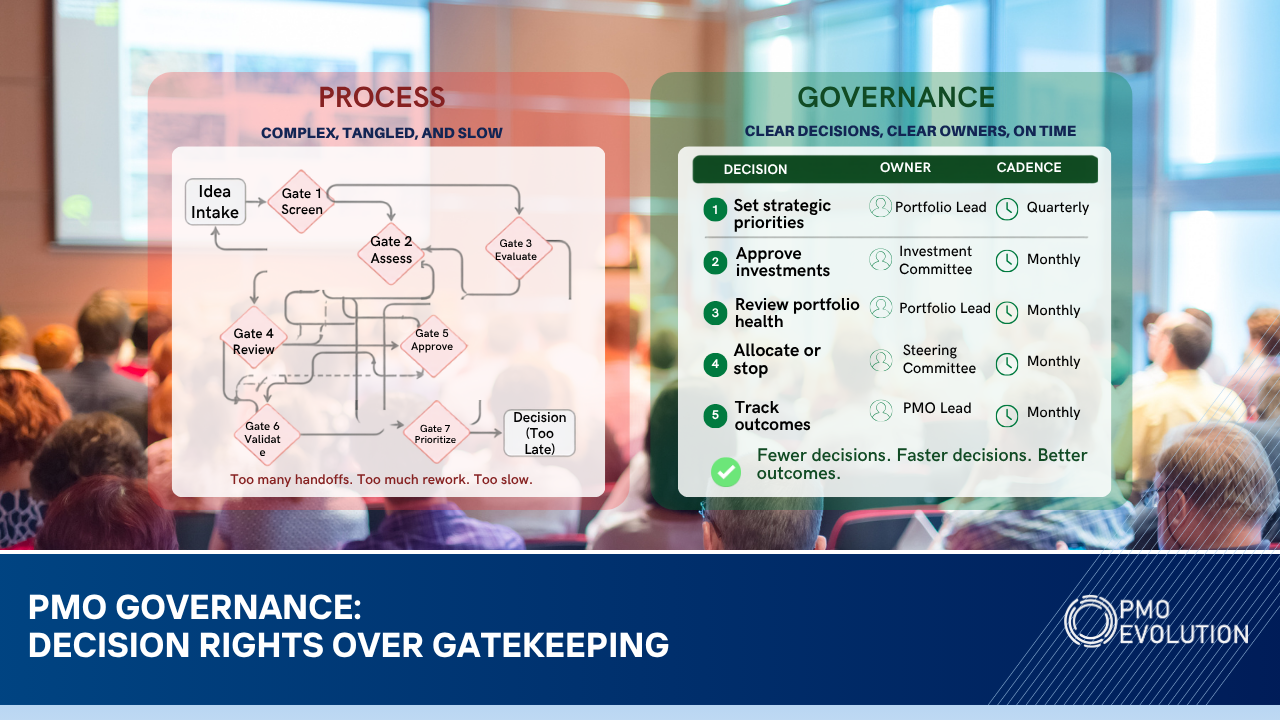
Yet when it comes to strategic decisions, prioritization, or direction-setting, the PMO often isn't in the room, or worse, they’re there, but their voice doesn't shift the outcome. This isn’t because the PMO isn’t doing the work. Most are working hard. The issue is what they’re measuring and what they’re not.
This is a common trap: Many PMOs track metrics that are easy to collect but meaningless to leaders:
- Number of projects delivered
- Percent of tasks completed
- Status color distribution
- Number of risks escalated
- On-time delivery percentage
They look neat in dashboards, but they don’t answer the only executive questions that matter:
📌 Did this improve the business?
📌 Are we allocating resources to the right initiatives?
📌 What is the financial and strategic return?
A project delivered "on time and on budget" doesn’t mean it delivered value. I’ve seen portfolios where more than 80% of initiatives were marked “green,” yet the organization still experienced shrinking margins, missed strategic targets, and frustrated stakeholders. Because work was being managed, not value.
The Vision2Value™ Model: Making Benefits the Center of the PMO Operating System
When I built the Vision2Value™ framework, it was for one purpose: to stop PMOs from reporting activity and start demonstrating impact.
The shift happens through three core capabilities:
1. Translate Strategy Into Measurable Intent
Before a project starts, define what success means, not in deliverables, but in outcomes.
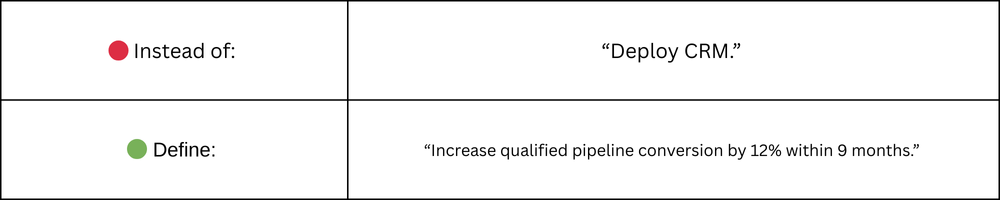
That clarity forces alignment, accountability, and meaningful measurement.
2. Track Benefits Through the Entire Lifecycle Not Just at Closure
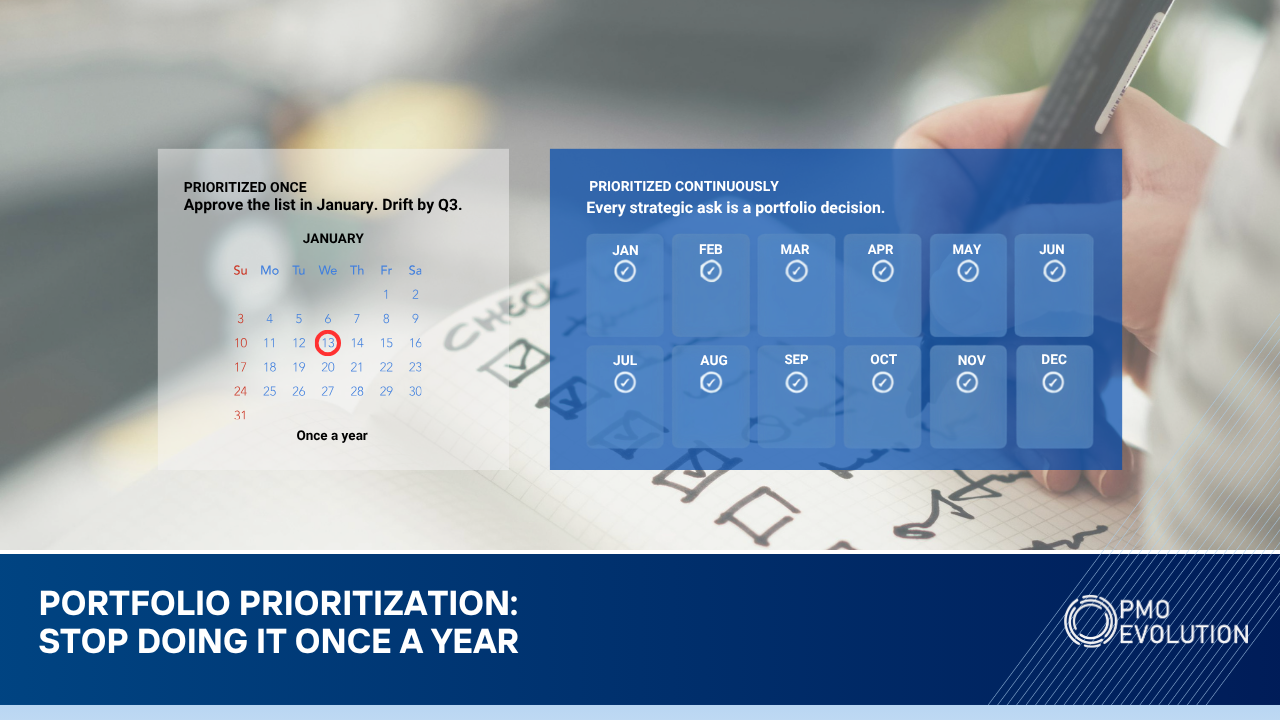
Most organizations measure projected benefits only once: during intake approval. After that? The benefit case disappears. Vision2Value™ embeds benefits realization checkpoints into governance rhythms; intake, planning, execution, stabilization, and post-implementation. If benefits drift, leadership sees it, in time to adjust.
3. Communicate Value in the Language of Business
Executives don’t need 14 columns of metadata or a color-coded status grid.
They need a clear narrative:
📌 What value has been realized?
📌 What value is forecasted?
📌 What’s at risk and what decisions need to be made?
When benefits reporting becomes part of decision-making, the PMO stops being an observer and becomes an enabler.
How to design a Benefits Tracker in Smartsheet
There’s a tendency to treat a benefits tracker as a spreadsheet exercise, a place to record a projected saving and tick a box at the end. That’s the wrong frame. A benefits tracker is an accountability model: it’s the thread that ties an initiative’s promise to the day-to-day work and the executive decisions that make or break realization.
In practice, the tracker must reflect three conversations that happen long before any field is filled:
➡️ what outcome the business expects,
➡️ how we will see progress toward that outcome before go-live, and
➡️ who owns the long tail of adoption and operation.
Smartsheet matters because it lets that accountability live in the same ecosystem as delivery: the benefit narrative travels with the work rather than sitting in a separate closure document. When a tracker is designed with those conversations in mind, it surfaces variance early, forces the conversation about assumptions, and makes the PMO’s role unmistakably about value, not just verification.
When leaders open the portfolio view and see benefits measured alongside milestones and dependencies, the discussion changes. It moves from defense (“we delivered”) to stewardship (“here’s what we enabled, what’s at risk, and what decision will protect value”). That is the purpose of the tracker: not to create another report, but to keep value visible and actionable.
(If you’d like to test this approach immediately, you can start with this benefits tracking template: https://www.smartsheet.com/template-gallery/benefits-tracking.
And if you want a more robust setup that supports your full portfolio, our Smartsheet solutions are outlined here: https://www.pmoevolution.com/smartsheetsolutions.)
Calculating ROI with real-world examples.
ROI in a PMO context is rarely linear, but it must still be quantified.
Here’s how a benefits-driven PMO frames real ROI, using scenarios I see repeatedly across organizations.
Example 1: Automation and Efficiency That Frees Up Capacity
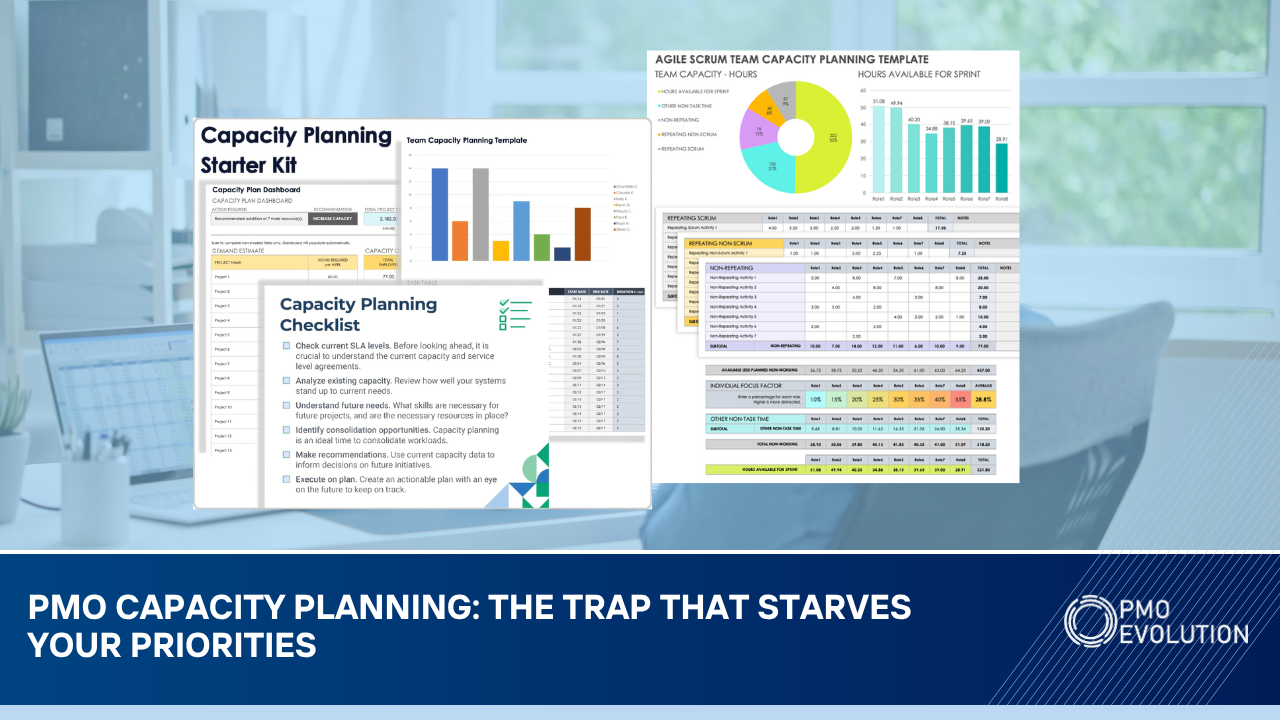
A large operations team spent an average of 14 hours per week consolidating reports across 19 active projects. After implementing automated portfolio reporting in Smartsheet, that cycle became 1.5 hours:
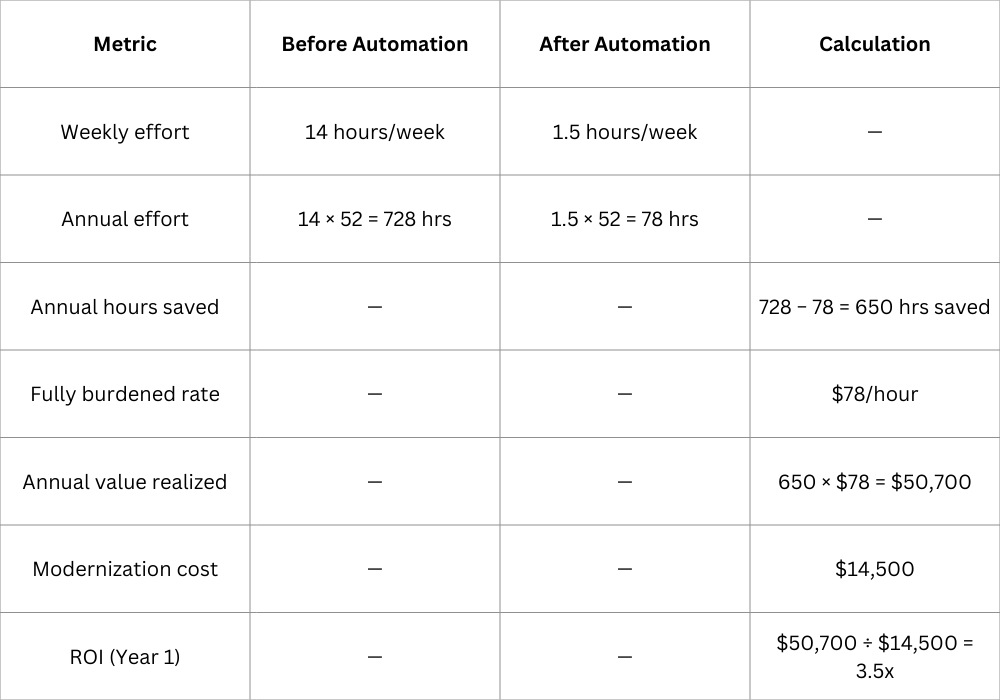
Year-one ROI
$50,700 ÷ $14,500 ≈ 3.5x
And that’s only the measurable value. It doesn’t include:
✅ Faster executive decision-making
✅ Improved forecast quality
✅ Reduced rework
✅ Higher confidence in reports
✅ Fewer late-night “the report goes out tomorrow” scrambles
These qualitative shifts often matter more than the dollars but the dollars open the door to the conversation.
Example 2: Strategic Prioritization & Redirected Value
A PMO replaced influence-driven approvals with Vision2Value scoring inside Smartsheet.
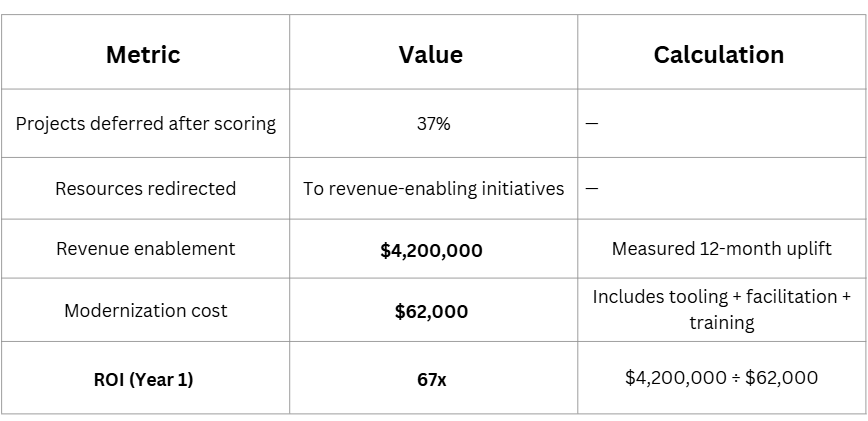
The PMO didn’t accelerate delivery, it prevented the wrong work, unlocking a 67x ROI by redirecting capacity toward strategic value.
If you want to know where your PMO really stands, it may be time to measure not just what's being done but whether it matters. I’m offering a Vision2Value™ Assessment for PMO leaders who want:
▪️ A clear current-state assessment
▪️ A benefits realization capability roadmap
▪️ And a practical plan to operationalize it in Smartsheet
Because the PMO earns influence not by reporting work but by proving impact.
If you'd like to schedule the diagnostic, visit: https://www.pmoevolution.com/pmo-consulting