
The Data-Driven PMO: How to Use Analytics to Drive Better Decisions
I’ve worked with PMO leaders across industries for years, and the same pattern keeps emerging. Teams are producing more data than ever; status updates, KPIs, risk logs, forecasts, capacity reports but the insight still feels thin. The numbers exist, the dashboards exist, the reports exist, yet when an executive asks, “What does this actually mean for the business?” the room often hesitates.
And it’s rarely due to a lack of capability. PMO leaders understand analytics. They understand governance. They understand the business. The real problem is that the data doesn’t flow in a way that supports decision-making. It sits in isolated pockets: a dashboard over here, a spreadsheet over there, a report that doesn’t connect to the one before it.
When information is scattered, the PMO becomes a curator of updates instead of a strategic advisor. Dashboards describe activity but not impact. Reports summarize progress but don’t shape decisions. Leaders see fragments instead of a narrative. And the PMO loses influence not because the data is wrong, but because it isn’t telling a story that leadership can act on.
That gap between information and insight is where credibility is won or lost. It’s also the gap the Vision2Value™ approach was built to close: organizing data around decisions, connecting signals across the portfolio, and giving PMO leaders a structure that turns raw details into strategic clarity.
The Vision2Value™ Approach to Structuring Data Flow
When I created Vision2Value™, it wasn’t to add another layer of reporting. It was to answer a more important question: How does a PMO ensure its information leads to action?
The approach focuses on three layers that work together:
Layer 1: Clarity on What Actually Matters
Not every metric influences executive decisions. Not every update changes the portfolio.
So the first step is defining:
- Which initiatives drive strategic outcomes
- Which risks could materially disrupt delivery
- Which dependencies impact cross-functional capacity
- Which benefits justify ongoing investment
When PMOs skip this step, they start reporting everything. When they follow this step, they start reporting what matters.
Layer 2: Designing the Information Pathway
Most PMO reporting issues come down to one question: Does the right data reach the right people at the right moment?
- Vision2Value maps this through:
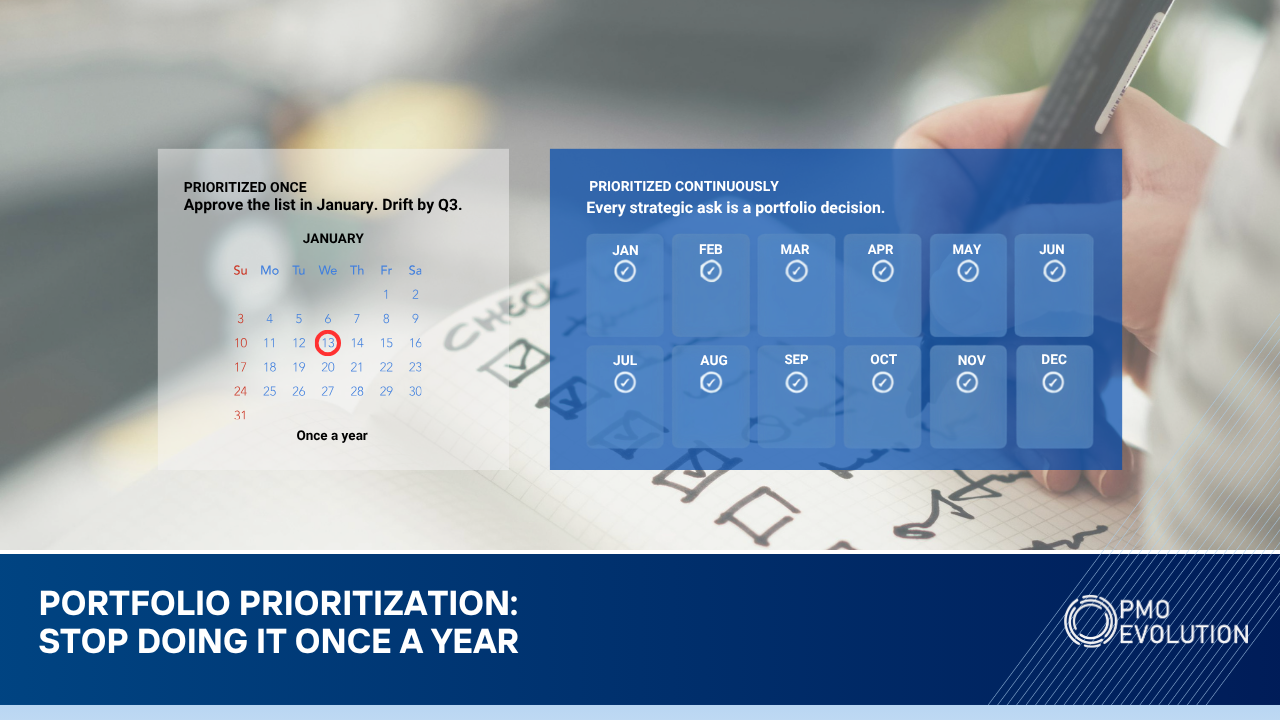
- Governance rhythms (weekly, monthly, quarterly)
- Portfolio checkpoints
- Trigger-based escalations
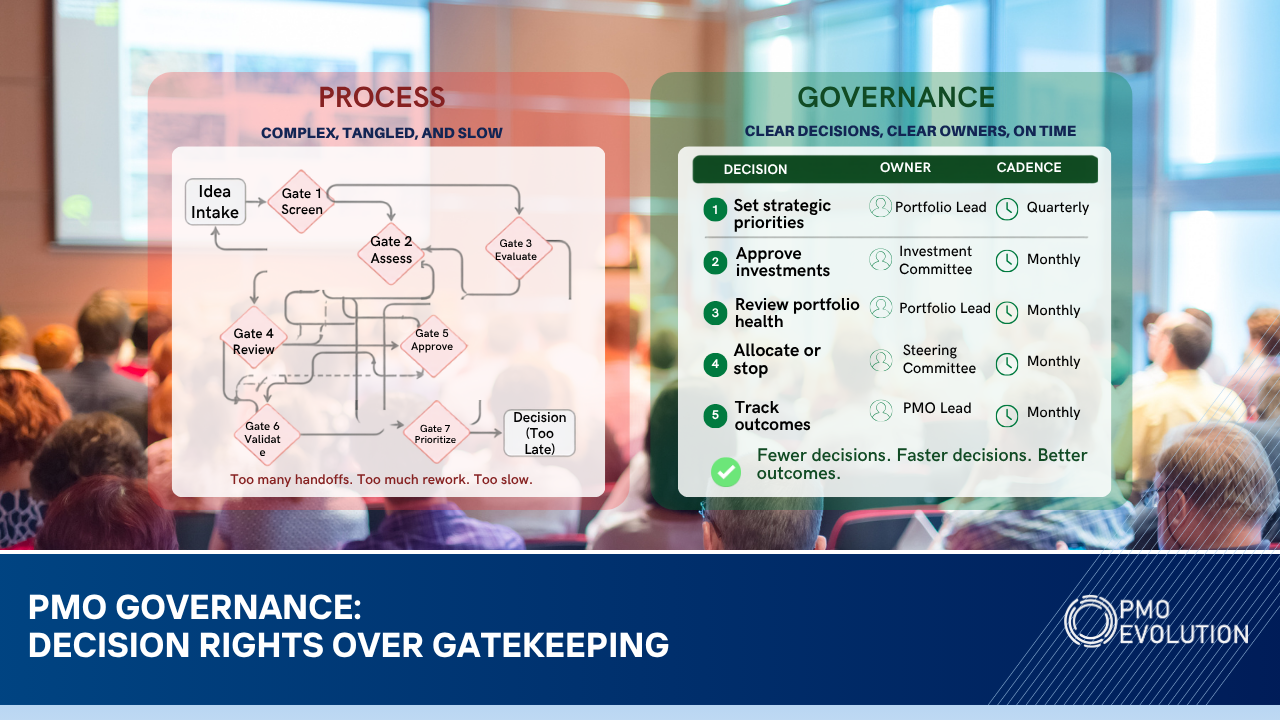
- Integrated stage-gate decisions
- Automated alignment between project and portfolio layers
This is the architecture that transforms updates into decision-ready insight.
Layer 3: Measuring Impact, Not Activity
This is where PMOs shift from “reporting progress” to “reporting value.”
Instead of tracking:
- Tasks completed
- Meetings held
- Documents approved
We track:
- Outcomes delivered
- Benefits progressing
- Risks mitigated
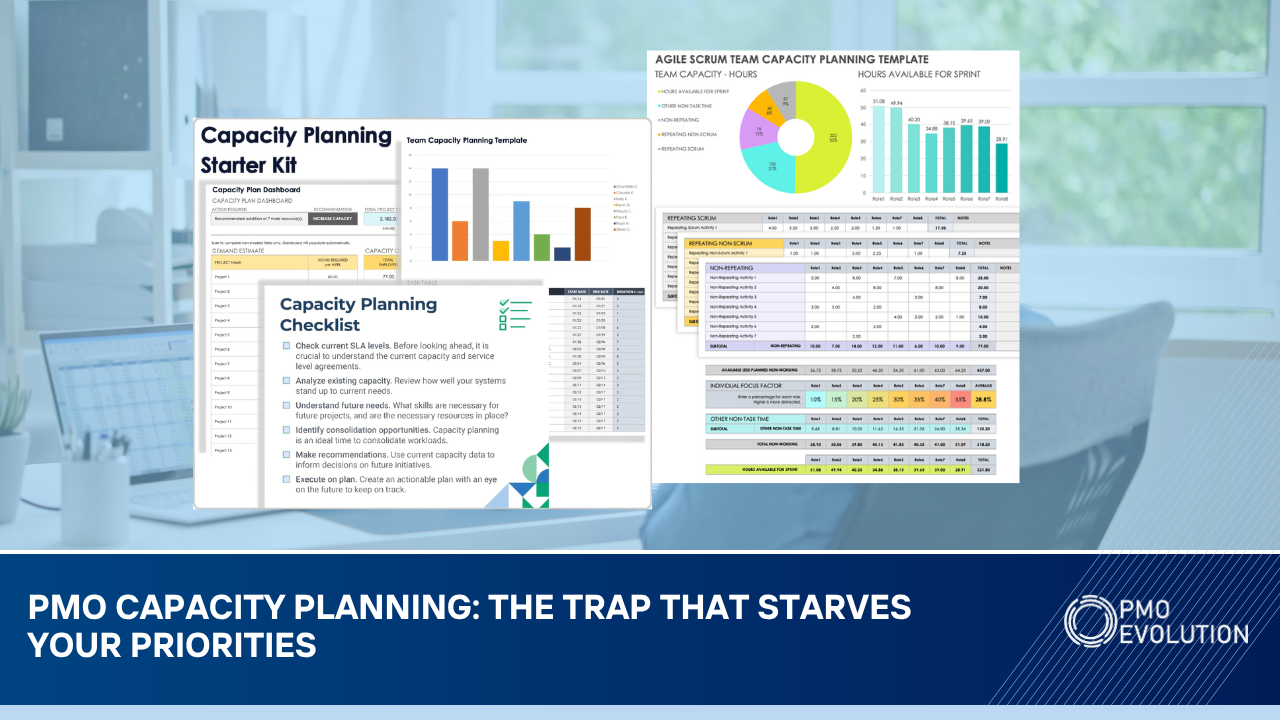
- Capacity unlocked
- Strategic blockers removed
This is the layer executives resonate with because it tells the story of impact, not motion.
When these three layers work together, dashboards stop being visual objects and become a leadership tool.
When these steps work together, the PMO gains something dashboards alone can’t deliver: a clear narrative that leaders can act on with confidence.
How Smartsheet Operationalizes Data-Driven PMO Practices
Tools don’t create insight, but they make insight possible at scale. And one of the reasons I often operationalize Vision2Value™ through Smartsheet is because it connects execution, governance, and reporting into a single system. Most PMOs don’t fail because they don’t have data, they fail because the data lives in too many places.
A connected Smartsheet environment becomes the infrastructure that allows insight to flow naturally. Project updates feed the portfolio without translation. Risks and dependencies escalate in real time. Benefits forecasts evolve as work progresses. And dashboards reflect the current state of the portfolio rather than a frozen snapshot prepared the night before.
Executives stop asking for “the latest version” because there is no version, there is only the truth of what’s happening right now. And when PMOs stop reconciling data and start interpreting it, conversations shift. Leaders no longer ask for more reporting. They ask for more insight.
This is where Smartsheet becomes more than a tool. It becomes the PMO's operating environment; an ecosystem where decisions are based on evidence, not instinct.
Learn more here --> https://www.pmoevolution.com/smartsheetsolutions
A PMO That Turned Data Into Executive Trust
One of the most memorable transformations I witnessed involved a PMO with strong processes, reliable teams, and accurate documentation yet the executive team still didn’t trust their reports. The dashboards were clean. The data was technically correct. But the information didn’t influence decisions because it lacked context.
Everything changed when we reframed the reporting structure. Instead of focusing on activities and timelines, the PMO began showing how each milestone contributed to strategic objectives, what risks meant for quarterly outcomes, and how investments aligned with the organization’s capacity to deliver.
They shifted from a “project update view” to a “value and risk narrative.”
It didn’t take long before executives started relying on the PMO to guide trade-offs, not just present updates. The relationship changed because the PMO changed the way it used data not by adding more of it, but by giving it meaning.
That’s what data-driven PMOs do. They interpret before they report.
Turning Insight Into Organizational Action
A data-driven PMO isn’t defined by the volume of information it collects. It’s defined by its ability to translate that information into decisions. When PMOs structure their data with discipline and use technology to reinforce that structure, they stop being a reporting function and start becoming a strategic ally.
The shift doesn’t happen overnight. But it begins the moment a PMO decides that data isn’t the goal; impact is.
If you want to see how this looks inside a real Smartsheet environment, I’m running short walkthroughs where I demo live dashboards and the Vision2Value™ flow in action.
You can book one here → pmoevolution.com/contact